Google Analytics 4 got rid of page value. That’s horrible because this metric helped you better understand how individual web pages contributed to the monetization of your site. But let’s not whine and instead look at two ways to bring page value back to GA4.
Key takeaways
- GA4 got rid of the built-in page value metric.
- That’s a bummer because it helped marketers to better understand how individual web pages contributed to the revenue.
- You have two options to, somehow, recreate page value: BigQuery and a GA4 exploration.
- If you do the hard work, page value can help you generate more revenue by pointing out web pages that require your attention.
What was Page Value in GA, anyway?
Let's start with Google's definition of Page Value as used in Universal Analytics:
The average value of this page or set of pages. Page Value is ((Transaction Revenue + Total Goal Value) divided by Unique Pageviews for the page or set of pages))
Google's explanation is a good one. But it's a bit complicated. Words are not always the best way to understand an equation.
Google also offers us this graphic to help us better understand how to calculate Page Value.
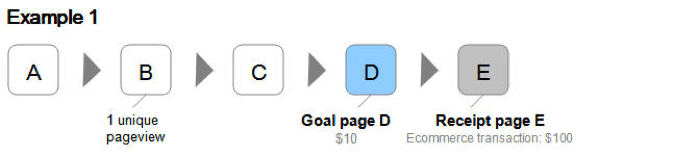
In this depiction, there's
- one unique pageview
- a conversion worth $10
- and a transaction that's worth $100.
So, the page value assigned is equal to $110.
The calculation is:
Page Value = (Revenue + Goals) ÷ Unique Pageviews
If you had multiple page views associated with a goal and purchase, your page value calculation might look like this:
(Revenue $100 + Goal $10)/ 5 Unique Pageviews = $22.00 Page value.
In this scenario, every page associated with the goal and purchase is assigned a $22.00 value.
Page Value distributes equal value across all the unique pageviews that lead to a conversion. It was not perfect – but it was straightforward, and it worked.
And then, it disappeared in GA4…
What was the value of page value in GA, anyway?
Google Analytics has all sorts of metrics to analyze the performance of your content: bounce rate, pageviews, etc.
You can even customize GA4 and get more insights about your content, such as content grouping, exits %, etc.
All of this is helpful to analyze the content of your website or web shop.
Alas, none of this helps you understand which pages, posts, or lists actually contribute to your bank account and conversions.
In the previous version of Google Analytics, one metric answered that question quickly: page value.
To help you better understand its value, and the loss for data-driven marketers, let me first explain why this was one of my favorite metrics.
Usually, when we want to look at the monetary value of our website, we look at the conversions or monetization report.
But these reports don’t tell you anything about which pages contributed to your business goals and which did not.
In the pages and screen report, you can also find data about conversions.

But the Pages and Screen report doesn’t tell the complete story:
- It doesn’t show the conversion rate per page.
- It doesn’t contain the revenue per page.
In other words: GA4 dumped Page Value and that sucks heavily.

There is, however, a logical explanation for this dark void.
Why can't I see the conversion rate in GA4 for my pages?
You can't see or add the conversion rate to your GA4 Pages and Screens report.
That’s weird, right?
All this emphasis on content, but no conversion rate!
The reason you can't see conversions in your Pages and screens report has to do with the scope of the metrics.
- Conversions are a session related metric, not a pageview related metric.
- In Google Analytics, pageviews are the action taken by a user to load a page in their browser. Users are unique devices (more accurately, cookies) that access your website.
- And sessions represent all the activity a user performs on your website during a 30-minute window of time.
A user can convert once, or more than once, during a session. So, a user's conversion is not associated with any one unique pageview, aside from the first page they visit – their landing page.
GA4 Landing Page conversion rates
The landing page is the first page of your visitor's session. Simply put, a landing page is the entry point on your site for a user's session.
Every session has one landing page hit. So landing pages are a session related dimension.
As we discussed, each session has a landing page. And the landing page dimensions work with the conversion metrics in your reports.
You can add the conversion rate metrics (for users and sessions) to the landing page report.

If you want to learn more about landing pages, you can read our full tutorial on the Landing Page report – How to Maximize the Google Analytics Landing Page Report.
The bottom line is that:
- you can see page level conversions in the Landing Page report, but not in the Pages and screen report.
- for standard page views, we don't have any conversion metrics.
Instead, the old GA version had Page Value and it was designed to help answer the question –“How much is a web page worth?”
But since that doesn’t exist in GA4, you either deal with it and move on. Or you implement a solution.
How to recreate page value in GA4?
Page value doesn’t exist in Google Analytics 4, but you can somehow recreate it. Depending on your needs, skillset and budget, here are your best two options.
- Using BigQuery to recreate page value with GA4
If you link GA4 and BigQuery, you have access to the raw data GA4 collects. It’s stored in a database and you can do some SQL magic to present it neatly.
One cool thing about SQL is that it can do calculations with the data and that’s a huge plus compared to GA4.
At this moment, you can create custom metrics in GA4, but calculated metrics are not a feature.
Building SQL query requires expertise. A faster way is to copy this one and follow the instructions in the comments.
When done properly, you will get the valuable page value back.
- Create a GA4 exploration report with page value
A custom GA4 exploration is the closest you can get to compose something similar as page value.
But keep the following in mind:
- GA4 collects data differently than in the old GA version.
- You must have set up conversions.
- You need to assign an event value for your conversions.
- GA4 doesn’t have calculated metrics, so you will have to do the calculations of the formula of page value. Exporting the report as a spreadsheet will save you time.
Your report could look like this:
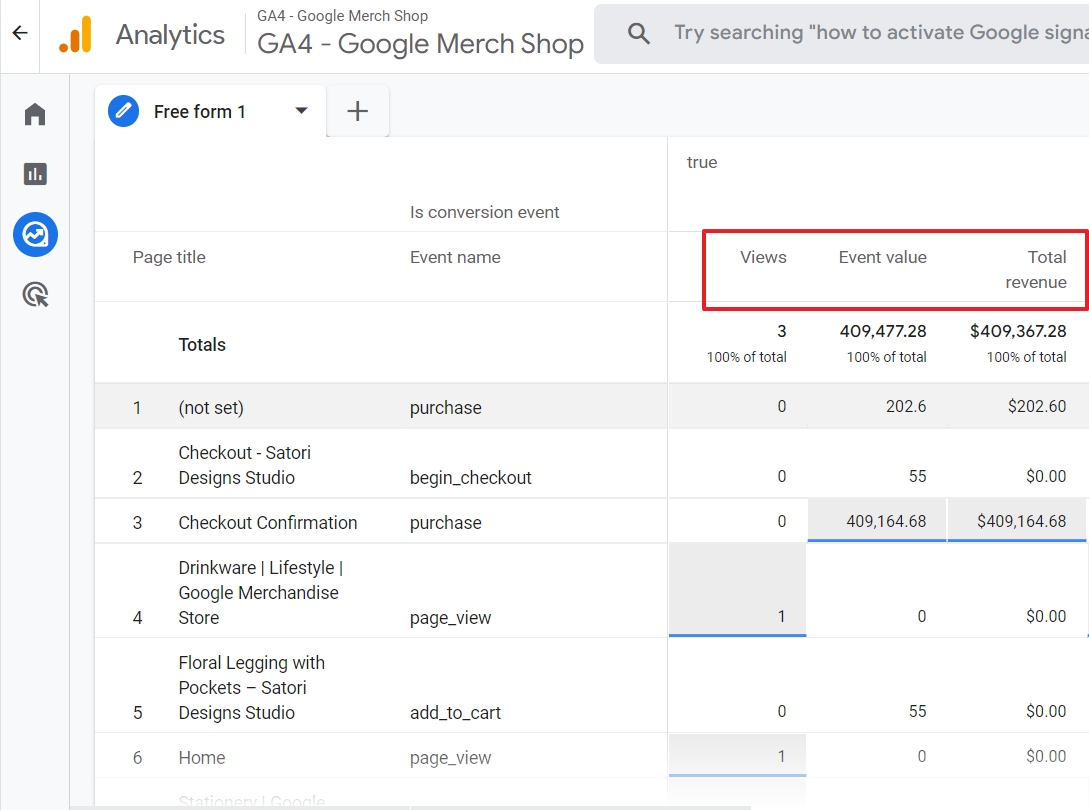
It’s far from perfect, and it takes some serious preparation to set up everything.
Collecting the proper data is different for every business. It all depends on your conversions and the best way to track them. Then, you also need to assign event values that make sense to you. For e-commerce that’s easier than for corporate sites that sell services or for blogs.
Things to keep in mind when looking at your Page Value
1. Page Value is always higher for cart pages
There are a couple of obvious reasons why cart pages have a higher value.
- Cart pages are almost always associated with a conversion.
- A visitor on a shopping cart page is more likely to result in a conversion being reached than someone reading a blog post.
- Also, some of your cart pages must be associated with every transaction.
So those pages will accrue a higher value than your other page since every conversion runs through them.
2. If your Page Value is $0 across the board, you need conversions
Without conversions, you won't have useful page values. So set up your conversions!
If you need help figuring out how to set up Goals check out these tutorials:
Google Analytics Conversion Tracking and Retroactive Goals
How do you Choose a Google Analytics Goal Value?
And… Sign up for Google Analytics Mastery Course.
Conversions are a super important part of Google Analytics! In the Analytics Course, we will help you understand funnels, conversion tracking, e-commerce conversions, etc.
3. If individual pages have low value, UPGRADE THEM
One way to improve a low-value page is to offer a content upgrade. Using lead magnets or email opt-ins can help you increase the value of your most popular content.
You can check out my full tutorial on creating content upgrades here – Content Upgrades and Lead Magnets: How to Create and Deploy.
4. Page Value is an easy self-test
If you see an exorbitantly high Page Value, either something you're doing is working or you are looking at false positives.
Remember, your cart pages will naturally have an inflated value.
Pages that have low value represent a chance to make improvements.
Your content on low-value pages may not be optimized. Or you may not have enabled any conversions associated with the content on your pages.
Page Value is a great way to understand the performance of your content. It's also a reminder to put conversions in place, and give your visitors a chance to convert on your best content.
And Page Value is a much better metric than Bounce Rate!!
Look at Page Value to assess the performance of your content instead of bounce rate.
What’s your best next step?
Either you dive into BigQuery to retrieve page value data from the data collected with GA4. Or you wait and hope GA4 will bring this precious metric back.
Don’t laugh.
It also happened with bounce rate.
First, it was gone, then it appeared again. In the meantime, data-driven marketers got used to the more valuable engagement rate.
With GA, one never knows, but that’s not a reason to panic.
It’s easy to stay on top of the latest changes in GA and the rapidly changing marketing landscape. All you need to do is read our free weekly newsletter.

